Humans are lousy at math and probability.
Math-Challenged
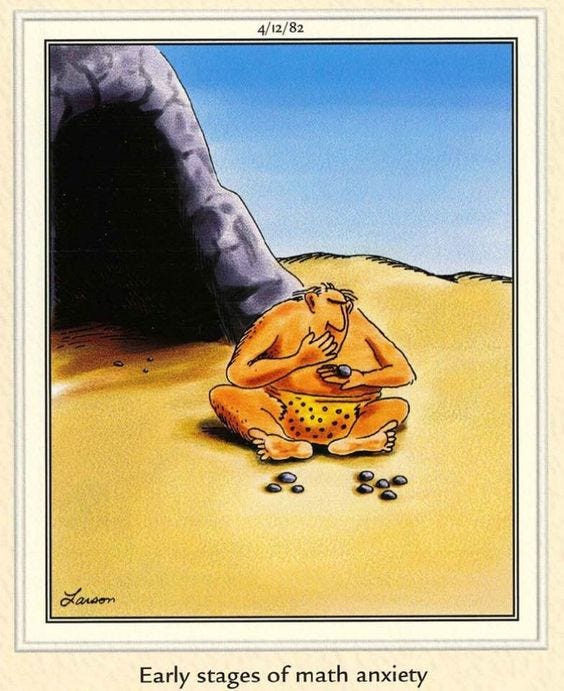
Math anxiety is real, and it is not altogether misplaced. For example, 40 percent of 12th-grade students tested below even basic mathematics achievement levels in the most recent national survey from the Educational Testing Service. Generally speaking, most of us are “math-challenged” in some significant way.
We are all prone to innumeracy, which is “the mathematical counterpart of illiteracy,” according to Douglas Hofstadter. It describes “a person’s inability to make sense of the numbers that run their lives.” Math is hard and often counterintuitive.
For example, most people would consider it an unlikely coincidence if any two people would share the same birthday in a room with 23 people in it. People would generally look at it like this: since one would need 366 people (in a non-leap year) in a room to be certain of finding two people with the same birthday, it seems to make sense that there is only a 6.28 percent chance of that happening with only 23 people in a room (23 divided by 366). However, 99 percent probability is actually reached with just 57 people in a room and 50 percent probability exists with only 23 people (see more on the “birthday problem” here).
A sum of money growing at 8 percent simple interest for ten years is the same as 6 percent (6.054 percent to be exact) compounded over that same period. Most of us have trouble thinking in those terms.
When things get more complicated we can really go off the rails, especially when the answer seems straightforward. To illustrate, if you have two children and one of them is a boy born on a Tuesday, what is the probability you have two boys? If you do not answer 13/27 or 0.481 — as opposed to the intuitive 1/2 – you’re wrong (to find out why go here).
We are especially poor at dealing with mathematical probabilities. If a weather forecaster says that there is an 80 percent chance of rain and it remains sunny, instead of waiting to see if it rains 80 out of 100 times when his or her forecast called for an 80 percent chance of rain (not that that sample size is nearly big enough – roughly 10,000 coin flips are required to determine if a coin is biased, for example, depending upon the amount of acceptable error allowed and the degree of confidence desired), we race to conclude — perhaps based upon that single instance — that the forecaster isn’t any good.
Moreover, “[w]e tend,” per Nassim Taleb, “to underestimate the role of luck in life in general (and) overestimate it in games of chance.” Accordingly, we tend to overpay for lottery tickets and insurance, both literally and figuratively.
There is a long list of mathematical concepts that people have trouble processing. One of them is geometric versus arithmetic increases. This distinction explains why many people didn’t understand why COVID would be a problem in the first place and likened it to the number of swimming pool drownings. It also explains why so many misunderstand investment returns.
Arithmetic progression means that a quantity increases linearly as time proceeds while geometric progression means that it increases as the square of time. Money managers prefer to report returns as an arithmetic average because this is almost always a higher number. However, an arithmetic average is inaccurate unless there is no volatility in returns. Because investment returns compound, volatility impacts total return and makes it lower than an arithmetic average.
To illustrate, suppose your investment portfolio gained 5o percent and lost 50 percent over two time periods. Your average return, on an arithmetic basis, per period, is 0 percent: (.50 + (- .50)) / 2 = 0. However, your actual return (the geometric average) is a 25 percent loss of capital. Say you started with $100 and lost 50 percent over one time period. You now have $50. A 50 percent increase from there puts your assets back to $75. If the order of the returns is reversed, the results are the same. A 50 percent increase on $100 brings your portfolio value to $150. The subsequent 50 percent decline will then bring your capital down to $75.
Another concept that people often struggle with is rates of increase and decrease. During February, the rate of decrease in new COVID cases shrank. It’s good news that the rate of new cases decreased but bad news that it began decreasing by less. For the first two weeks of February, the number of new cases went down by 54 percent; for the last two weeks, the number of new cases went down by 7 percent. That’s not bad news, exactly, but it’s reason to be concerned that a “fourth wave” of infections might be coming.
We also struggle with what the anthropologist John Tooby calls nexus causality, which is math-adjacent. We are wired to believe in linear causes and effects: that A causes Z. We don’t deal well with a world – which is the real one – where a litany of inputs (A, B, C, D, and so on) combine in some unique way to cause Z. Math isn’t a great help here since our statistical models are not well-equipped to model that sort of complexity. And we don’t have counterfactuals to test any hypotheses we might have.
As Tooby said, “We all start from radical ignorance in a world that is endlessly strange, vast, complex, intricate, and surprising.” When we know how things turned out, we readily convince ourselves that what happened was inevitable and that we knew it all along. We easily create narratives explaining why. Yet it is exceedingly difficult, perhaps impossible, to disentangle all the threads that lead to even a given result.
Kahneman and Tversky have powerfully demonstrated that we evolved to make quick and intuitive decisions for the here-and-now ahead of careful and considered decisions for the longer term. We intuitively emphasize (per Tooby) “the element in the nexus that we [can] manipulate to bring about a favored outcome.” Thus, “the reality of causal nexus is cognitively ignored in favor of the cartoon of single causes.”
Life does not lend itself to easy explanations.
The inherent biases we suffer (as discovered by behavioral finance) make matters worse. For example, we’re all prone to the gambler’s fallacy – we tend to think that randomness is somehow self-correcting (the idea that if a fair coin is fairly tossed nine times in a row and it comes up heads each time, tails is more likely on the tenth toss). However, as financial services commercials and literature take pains to point out (as regulatorily required), past performance is not indicative of future results. On the tenth toss, the probability remains 50 percent.
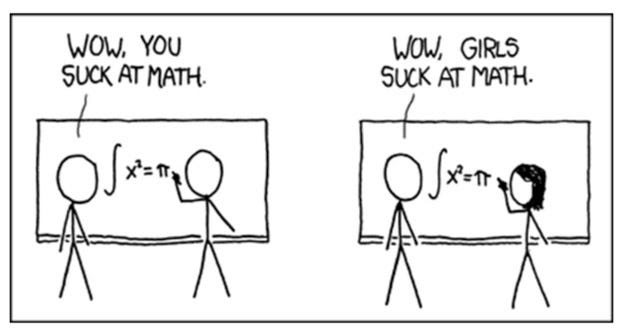
We also tend to suffer from availability bias and thus value our anecdotal experience over more comprehensive data (see the cartoon below, from XKCD). For example, the fact that most of your friends use Parler is not enough evidence to conclude that it’s a good product (much less a good investment).
The conjunction fallacy is another common problem whereby we see the conjunction of two events as being more likely than either of the events individually. Consider the following famous example. A group of people was asked if it was more probable that Linda was a bank teller or a bank teller active in the feminist movement from the following data points: Linda is 31 years old, single, outspoken, and very bright. She majored in philosophy. As a student, she was deeply concerned with issues of discrimination and social justice, and also participated in anti-nuclear demonstrations. Fully 85 percent of respondents chose the latter, even though the probability of two things happening together can never be greater than that of the events occurring individually.
Now suppose that Company X has a workforce that is only 20 percent female. The base-rate fallacy would suggest that the company is discriminatory. But further analysis is required. If the applicant pool was only 10 percent female, Company X might actually have an exemplary record of hiring women.
When Daniel Kahneman was asked why it is so difficult for people generally to compute and deal with probabilities, he offered an interesting answer: “to compute probabilities you need to keep several possibilities in your mind at once. It’s difficult for most people. Typically, we have a single story with a theme. People have a sense of propensity, that the system is more likely to do one thing than the other, but it’s quite different from the probabilities where you have to think of two possibilities and weigh their relative chances of happening.”
We prefer to think linearly, manufacturing a storyline, in effect, with a beginning, middle, and end. That’s why we are so susceptible to the “narrative fallacy.” We inherently prefer stories to data. Contingencies and (perhaps random) consequences don’t correspond to the way we like to see the world. We are — pretty much all the time — either looking backward and creating a pattern to fit events and constructing a story that explains what happened along with what caused it to happen, fitting what we see or assume we see into a preconceived narrative, or both.
As Adam Gopnik sagely pointed out, “nothing works out as planned,” and “everything has unintentional consequences.” Moreover, “the best argument for reading history is not that it will show us the right thing to do in one case or the other, but rather that it will show us why even doing the right thing rarely works out.” What history generally “teaches” is how hard it is for anyone to control it, including the people who think they are making it. The study of history means seeing the planning fallacy writ large … over and over again.
Most of the world offers, when we get things right, scientific (inductive) answers, which are often awesome but also necessarily tentative. Math, on the other hand, offers deductive (certain) answers. Those answers are not sufficient for overall success, of course. We must all make value judgments and difficult choices under uncertainty. However, in many areas – like investing – those certain answers are a necessary predicate to consistent, ongoing success.
In his famous 1974 Cal Tech commencement address, the great physicist Richard Feynman talked about the scientific method as the best means to achieve progress. Even so, notice his emphasis: “The first principle is that you must not fool yourself – and you are the easiest person to fool.” The examples above make Feynman’s point. It’s easy to fool ourselves, especially when we want to be fooled – we all really like to be right and have a vested interest in our imagined rightness. If our analysis is going to be data-driven and evidence-based (and those are very good things), we need to check our work and our biases very carefully always, and especially because we suck at math and are even worse at probability.
So, make your approach as data-driven as you can. Create a careful process that relies upon reality rather than predictions about the future (getting your predictions right is much less important than calculating payoffs accurately). Work the problem. Sometimes, especially when there is a lot of available math, things do work out.
Không có nhận xét nào:
Đăng nhận xét